


Beschreibung von Desmos Graphing Calculator
At Desmos, we imagine a world of universal math literacy and envision a world where math is accessible and enjoyable for all students. We believe the key is learning by doing.
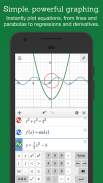
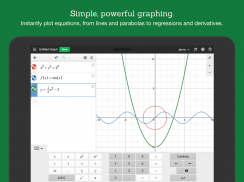
To achieve this vision, we’ve started by building the next generation of the graphing calculator. Using our powerful and blazingly-fast math engine, the calculator can instantly plot any equation, from lines and parabolas up through derivatives and Fourier series. Sliders make it a breeze to demonstrate function transformations. It's intuitive, beautiful math. And best of all: it's completely free.
Features:
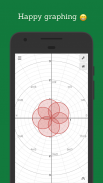
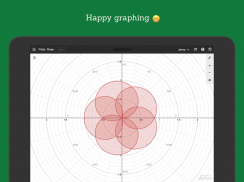
Graphing: Plot polar, cartesian, or parametric graphs. There’s no limit to how many expressions you can graph at one time - and you don’t even need to enter expressions in y= form!
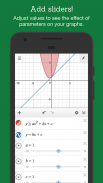
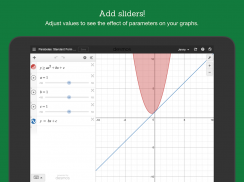
Sliders: Adjust values interactively to build intuition, or animate any parameter to visualize its effect on the graph
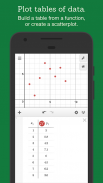
Tables: Input and plot data, or create an input-output table for any function
Statistics: Find best-fit lines, parabolas, and more.
Zooming: Scale the axes independently or at the same time with the pinch of two fingers, or edit the window size manually to get the perfect window.
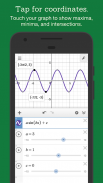
Points of Interest: Touch a curve to show maximums, minimums, and points of intersection. Tap the gray points of interest to see their coordinates. Hold and drag along a curve to see the coordinates change under your finger.
Scientific Calculator: Just type in any equation you want to solve and Desmos will show you the answer. It can handle square roots, logs, absolute value, and more.
Inequalities: Plot cartesian and polar inequalities.
Offline: No internet access required.
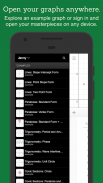
Visit www.desmos.com to learn more and to see the free online version of our calculator.
Bei Desmos, stellen wir uns eine Welt der universellen Mathematik Alphabetisierung und sehe eine Welt, Mathematik zugänglich und angenehm für alle Schüler ist. Wir glauben, dass der Schlüssel learning by doing.
Um diese Vision zu erreichen, haben wir durch den Bau der nächsten Generation des Grafik-Taschenrechner gestartet. Mit unserem leistungsfähigen und blitzschnelle mathematische Motor kann der Rechner sofort zeichnen jede Gleichung, aus Linien und Parabeln oben durch Derivate und Fourier-Reihe. Sliders machen es zu einem Kinderspiel, um Funktion Transformationen demonstrieren. Es ist intuitiv, schöne Mathematik. Und das Beste ist: es ist völlig kostenlos.
Eigenschaften:
Grafische Darstellung: Grundstücks polar, kartesisch oder parametrischen Graphen. Es gibt kein Limit, wie viele Ausdrücke, die Sie bei auf einmal Graph - und Sie brauchen noch nicht einmal, um Ausdrücke in y = Feld ein!
Sliders: Stellen Sie Werte interaktiv zur Intuition zu bauen oder zu animieren jeden Parameter, um seine Wirkung auf das Diagramm visualisieren
Tabellen: Input und Plot-Daten oder eine Input-Output-Tabelle für jede Funktion zu erstellen
Statistik: Hier finden Sie Best-Fit-Linien, Parabeln und mehr.
Zoomen: Skalieren Sie die Achsen unabhängig voneinander oder gleichzeitig mit der Prise zwei Finger oder die Fenstergröße manuell bearbeiten, um die perfekte Fenster.
Sehenswürdigkeiten: Berühren Sie eine Kurve an Maxima, Minima und Schnittpunkte zeigen. Tippen Sie auf die grauen Punkte von Interesse für ihre Koordinaten zu sehen. Halten und ziehen entlang einer Kurve zu sehen, die Koordinaten unter Ihrem Finger ändern.
Scientific Calculator: Geben Sie einfach jede Gleichung Sie lösen wollen und Desmos zeigen Ihnen die Antwort. Es kann Quadratwurzeln, Protokolle, Absolutwert, und mehr zu behandeln.
Ungleichheit: Grundstück kartesischen und polaren Ungleichheiten.
Offline: Kein Internetzugang erforderlich.
Besuchen www.desmos.com um mehr zu erfahren und zu der kostenlosen Online-Version unserer Rechner zu sehen.


Desmos Graphing Calculator – APK Informationen
APK Version: 7.12.0.0Paket: com.desmos.calculatorApps in derselben Kategorie
Das könnte dir auch gefallen...


